What the heck is ACV?
Metric Stack 20: Annual Contract Value and more!
Annual Contract Value (ACV) is a somewhat misunderstood and confusing metric in the SaaS world. It’s not always clear what to include in your calculations - do you include one-time fees or leave them out? And how is ARR different from ACV? Is your ACV supposed to be higher than it is right now?
Welcome to Metric Stack Edition 20! I’m Priyaanka Arora, your personal metric assistant and Content Researcher & Writer at Klipfolio. You’ll find the answers to all these questions, and more, in this edition of the newsletter.
Make sure you read till the end for a visual example of how to track ACV in a dashboard. Let’s jump right in!
What is Annual Contract Value?
Annual Contract Value (ACV) is the average dollar value brought in by all of your contract customers in one year. These can be single-year or multi-year contracts. If you’re in the subscription business and offer an annual or recurring yearly contract, ACV is extremely relevant to you. Here’s the formula:
ACV = Value of all customer contracts for one year / number of customer contracts in that year
One of the most confusing things about ACV is that there is no single definition or formula agreed upon by the industry. So whether you choose to include one-time fees in your calculation is really up to you.
To help you decide, ask yourself if this is a default fee included with every new contract - such as on-boarding or installation fees. In such cases, you may want to include one-time fees in ACV. If one-time fees are contract-specific or varying, it might be better to leave them out of the equation.
What’s a good ACV benchmark?
As Lauren Thibodeau, SaaSCan Founder and Chief Research Officer, mentions on MetricHQ,
“There is really no ACV benchmark, because there’s nothing necessarily good or bad about a high or low ACV”
That being said, there is some industry research on ACV benchmarks. A slightly older benchmark survey from 2015 features on multiple sources on the internet stating that the median ACV is $21,000 - but this is a small sample size of exclusively top performing companies.
OpenView’s 2017 benchmark report includes ACV benchmarks segmented by target customer type, software type, and sales channel. Take a look:
As you can see, ACV can vary by target customer type, skewed towards lower values for smaller customers and higher values ranging between $10K to > $250k for companies targeting mid-market/enterprise customers. So does that mean it’s better to have a high ACV?
Not necessarily! If your ACV is low but your customer volume is high, you’re essentially making the same as higher ACV companies but realizing it through smaller contract sizes. In fact, you could argue that low ACV and high customer volume lowers your Customer Concentration, reducing the risk of losing “big fish” customers that could put a dent in your revenue.
Why should you track ACV?
You might be wondering why you need to track ACV when you already track Annual Recurring Revenue (ARR). You can read in detail about the difference between ACV and ARR on MetricHQ, but in short:
ACV is the average of yearly contract size and ARR is the sum of yearly recurring revenue. These two metrics are leading indicators for two completely different business performance aspects.
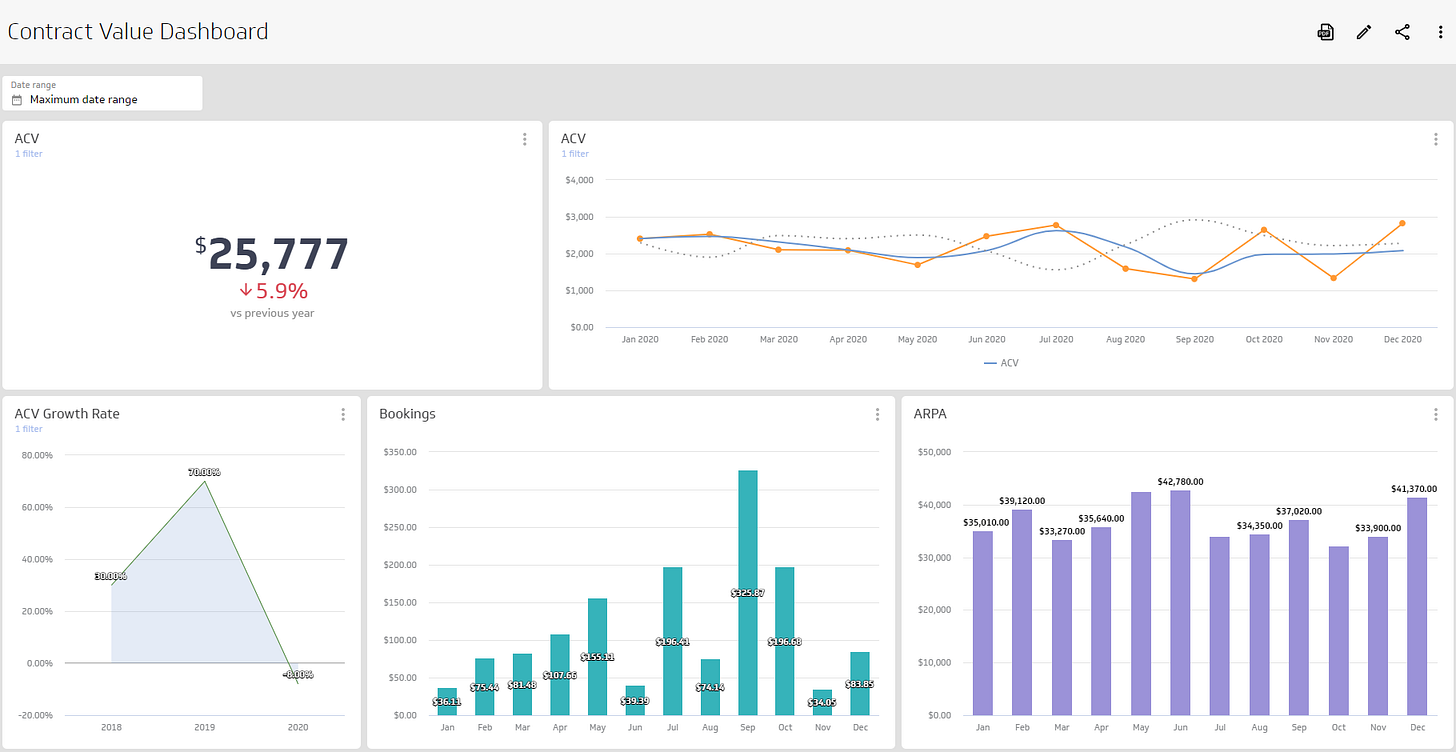
You should track ACV to evaluate your sales and customer success team performances. Your ACV can be used to judge how much to invest in sales and marketing. ARR, meanwhile, is a great indicator of company growth. Additionally, metrics such as Bookings, ACV Growth Rate, and Average Revenue per Account will give you a robust picture of both revenue growth and sales & marketing efficiency and ROI.
This set of metrics is especially important if you follow, or are planning to follow, product-led growth where the role of marketing and sales merely starts with the contract and goes on to nurture, up-sell, and cross-sell.
When you’ve selected your key metrics and have your data ready, throw it all together onto a dashboard you can refer to when measuring your business performance. Here’s an example of what your dashboard can look like:
Check out this starter guide to dashboards for tips on how to create your very own dashboard, made possible by PowerMetrics - Klipfolio’s free forever analytics tool.
Tune in to the Metric Stack Podcast!
Did you catch the first episode of the Metric Stack podcast last week? Erin Bury, co-founder and CEO of Willful shared how Willful became a data-driven and metrics-led company that is changing the way people approach estate planning.
Listen to the episode on Apple, Spotify, Google or wherever you get your podcasts.
And tune in for a new episode tomorrow with Mike Potter, co-founder and CEO of Rewind.


