Metric Stack - Inviting Guest Writers, Net Promoter Score, and more!
Fourth edition: word of mouth can make or break you
Welcome back to Metric Stack. I’m Priyaanka Arora, your personal metric assistant and Content Researcher & Writer at Klipfolio. We’re going to bring the focus back on the customer this week by discussing Net Promoter Score.
But first: I have some news I can’t wait to share with you. It’s a lot of fun! Are you ready?
Metric Stack is inviting guest writers!
How often do you read an article and feel the urge to say something about it? This is your chance. I’m looking for guest writers passionate about SaaS, Finance, or Marketing who would love to share their thoughts with a growing audience of 550+ people. Not a writer? No problem. Just share your thoughts with me and I’ll help you refine your very own guest post to feature in an upcoming edition of this newsletter. Excited? Reach out to me below or comment on this post to learn more.
And now, back to metrics! Last week, we discussed the intriguing concept of how you’re either driving revenue or raising hype. That got me thinking of a different kind of hype. I’m talking about the buzz surrounding your product, aka customer reviews. This week, we’re going to look at a metric that sounds fancy but is very simple to understand and very, very important to the continued success of your business.
What is Net Promoter Score?
Net Promoter Score (NPS) measures how willing your customers are to spread the word about your product or service. It is calculated based on tons of customer survey responses and works by classifying customers into "Promoters", "Neutrals", and "Detractors". Here's the formula:
Net Promoter Score (NPS) = Percentage of Promoters - Percentage of Detractors
How do you calculate Net Promoter Score?
Survey your customers by asking them how likely it is that they would recommend your product. Offer them a scale of one to ten. Then, group all the 9s and 10s as Promoters, 8s and 7s as Neutrals, and 6s and below as Detractors. Now, subtract the percentage of Detractors from the percentage of Promoters and that's your NPS.
Net Promoter Score Example
Imagine for a delicious minute that your online store, Cookie Paradise, sells freshly baked cookies. With each box of cookies you send out, you offer a small discount for customers who take your survey which includes the question "how likely is it that you would recommend Cookie Paradise to friends and family?"
Within a couple weeks, you get 200 responses. Out of these, 100 give you a 9 or 10 but around 30 customers score 6 or lower for willingness to spread the word about your tasty cookies. When you take a break from munching on cookies, do some quick math: 100 / 200 or 50% of your survey responses are Promoters. Similarly, 30 / 200 or 15% of the responders are Detractors. This gives you a Net Promoter Score of 50% - 15%, which is 35.
Ok, now you have your NPS. What do you do with it? Well, it helps to compare it with some benchmarks to see where you stand.
What’s a good Net Promoter Score (NPS) benchmark?
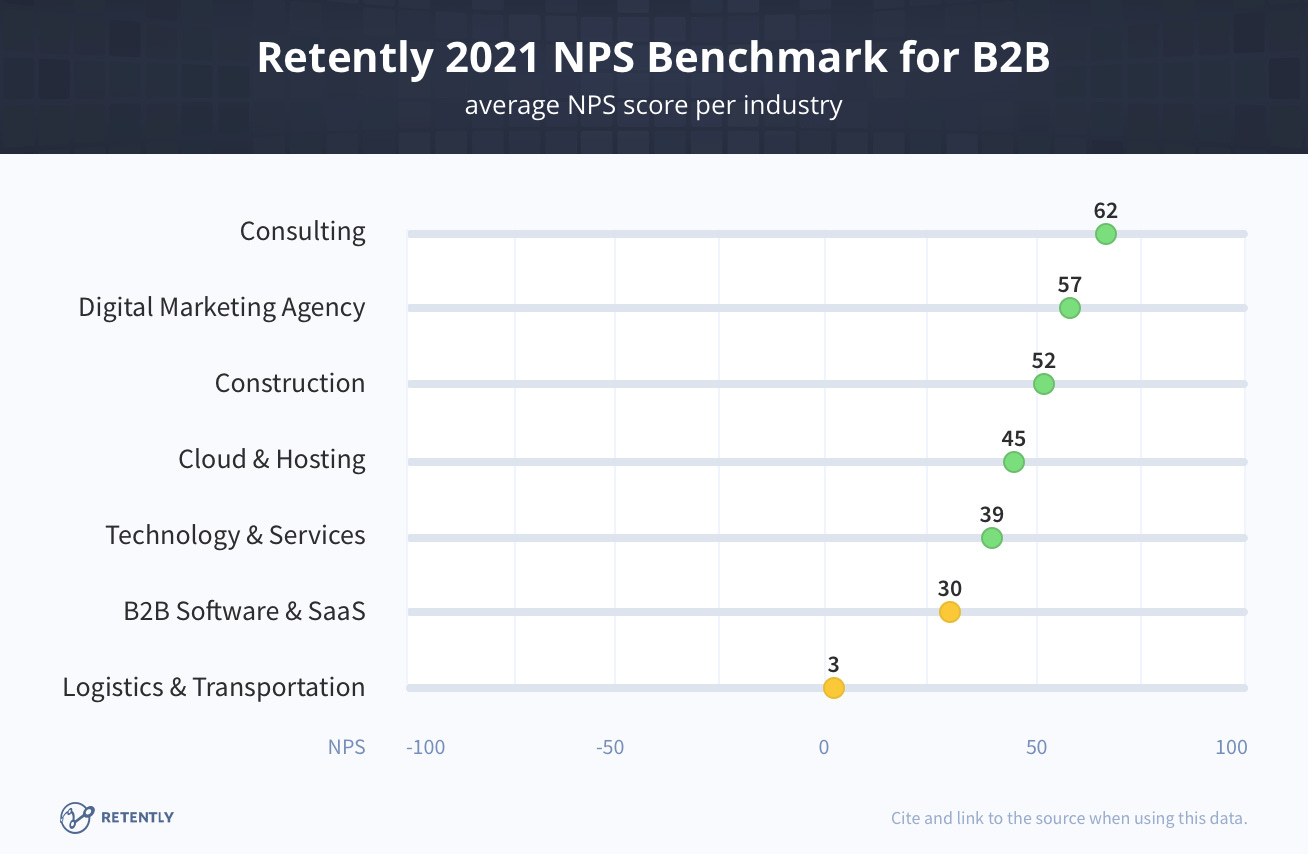
A good Net Promoter Score ranges between 30 and 60 depending on the industry, based on a 2021 NPS benchmark study by Retently.
The average NPS is around 30 for B2B SaaS companies and an outstanding 62 for B2B consulting companies.
NPS ranges slightly lower for B2C companies, from 20s and 30s to high 50s. Keep in mind that these numbers are only a general indicator of customer satisfaction. It is always important to track several metrics rather than depending too heavily on any single indicator of success.
Why should you track Net Promoter Score?
You should track your Net Promoter Score because it is the percentage of customers who love your product so much that they rave about it to their network. NPS can help you map loyal customers who have essentially declared “Yes! I am going to tell others I love your product!” And if that’s not pure value, I’m not sure what is.
Think back to when we talked about the buzz surrounding your product. Word of mouth is powerful enough to elevate your brand to cult status. While it’s not likely going to help you scale your business, it is going to help secure loyal customers who are less likely to churn.
NPS is a powerful tool if you know how to apply it to your business and if you track it over time. You’ll identify what makes your customers happy while getting an early warning of any potential dissatisfaction. Those 7s and 8s, our Neutrals? Once you identify them, it gets easier to push lukewarm customers into becoming devoted to your brand!
If I’ve convinced you to start tracking NPS, share this edition of Metric Stack with your friends and colleagues so they can benefit from elevated customer success tracking as well!
What’s new on MetricHQ?
Here’s your freshly baked (still thinking about those cookies from earlier) set of new metrics on MetricHQ, a massive online dictionary of metrics and KPIs that powers this newsletter!
Check out this super awesome growth metric, Natural Rate of Growth. Follow that up by learning about Cost per Activated Lead and Product Qualified Leads. With this trio of metrics, you’re sure to walk away with insights into how to measure growth in your business.
Stay tuned for the next edition of Metric Stack Newsletter to get the latest scoop on all things metrics! Send feedback, comments, questions here: parora@klipfolio.com


