


Metrics: A researcher’s perspective


Summary:
Looking for the best way to make data-driven business decisions? Look no further! In this article, researcher Matthew Brown explains how data and business teams work together to build a library of essential business metrics. You’ll learn why metrics are well-suited for quantitative, unbiased data research - and - how having access to defined, consistent metrics means business teams can make decisions based on data, not instinct.
What exactly is a metric?
The term metric is often used interchangeably with measure or Key Performance Indicator (KPI). Even analysts sometimes struggle to understand the differences between these terms. However, as the popularity of metric analysis grows, more and more people are learning what makes metrics unique – metrics are both a data structure and a business concept. In his article on the benefits of metrics, senior software developer Graham Watts defines a metric as follows:
“A metric is a data structure that refers to a single, meaningful, measurable business concept. A metric includes the history of that value and the categories that the value can be broken down into (also called dimensions).”
In most cases, a metric has multiple data points that have been or can be:
aggregated (e.g., average room temperature over the last 12 hours),
segmented (e.g., temperature on first floor vs. second floor), and/or
combined with other measures (e.g., difference between room temperature and outdoor temperature).
Business metrics are a subset of metrics that are commonly used to measure business health and help guide business decisions. If you’re not sure about the difference between measures, metrics, and KPIs, I recommend reading this informative comparison, written by Jonathan Taylor.
Which teams in your organization should be using metrics?
My knee-jerk reaction to this question was “Every team, of course!”. However, I quickly realized this initial response was an overgeneralization and highly uninformative. It also reminded me that fast, gut-based decisions/responses are usually suboptimal – but more on that later. After further reflection, I narrowed down my response to include 2 broad groups of people in an organization that should be using metrics:
Decision makers
Decision informers
Who are the decision makers?
Decision makers are the people who make decisions that impact the direction a business takes and define the strategies used to steer the company in that direction. While historically, this group is often referred to as the executive team or the C-suite, modern work cultures expect data-driven decision making from all their skilled knowledge workers, regardless of their level within the organization. For the most part, I’ll refer to this group as the business team.
Who are the decision informers?
Decision informers are the people who extract, analyze, summarize, and communicate the data that the business team uses to make their decisions. This group may include database administrators, data engineers/architects, data analysts/scientists, and researchers. I’ll refer to this group as the data team.
How do business teams and data teams work together?
The following image illustrates the cyclical connection between the data team and the business team. Sometimes, as in pathway A, the information that’s shared with the business team is generative research that originates from within the data team. At other times, as in pathway B, the business team requests specific information from the data team.
Business metrics are the fuel that drives these two interconnected teams. These metrics are the common language of business teams and data teams and are essential for translating elemental measurement into actionable insights.
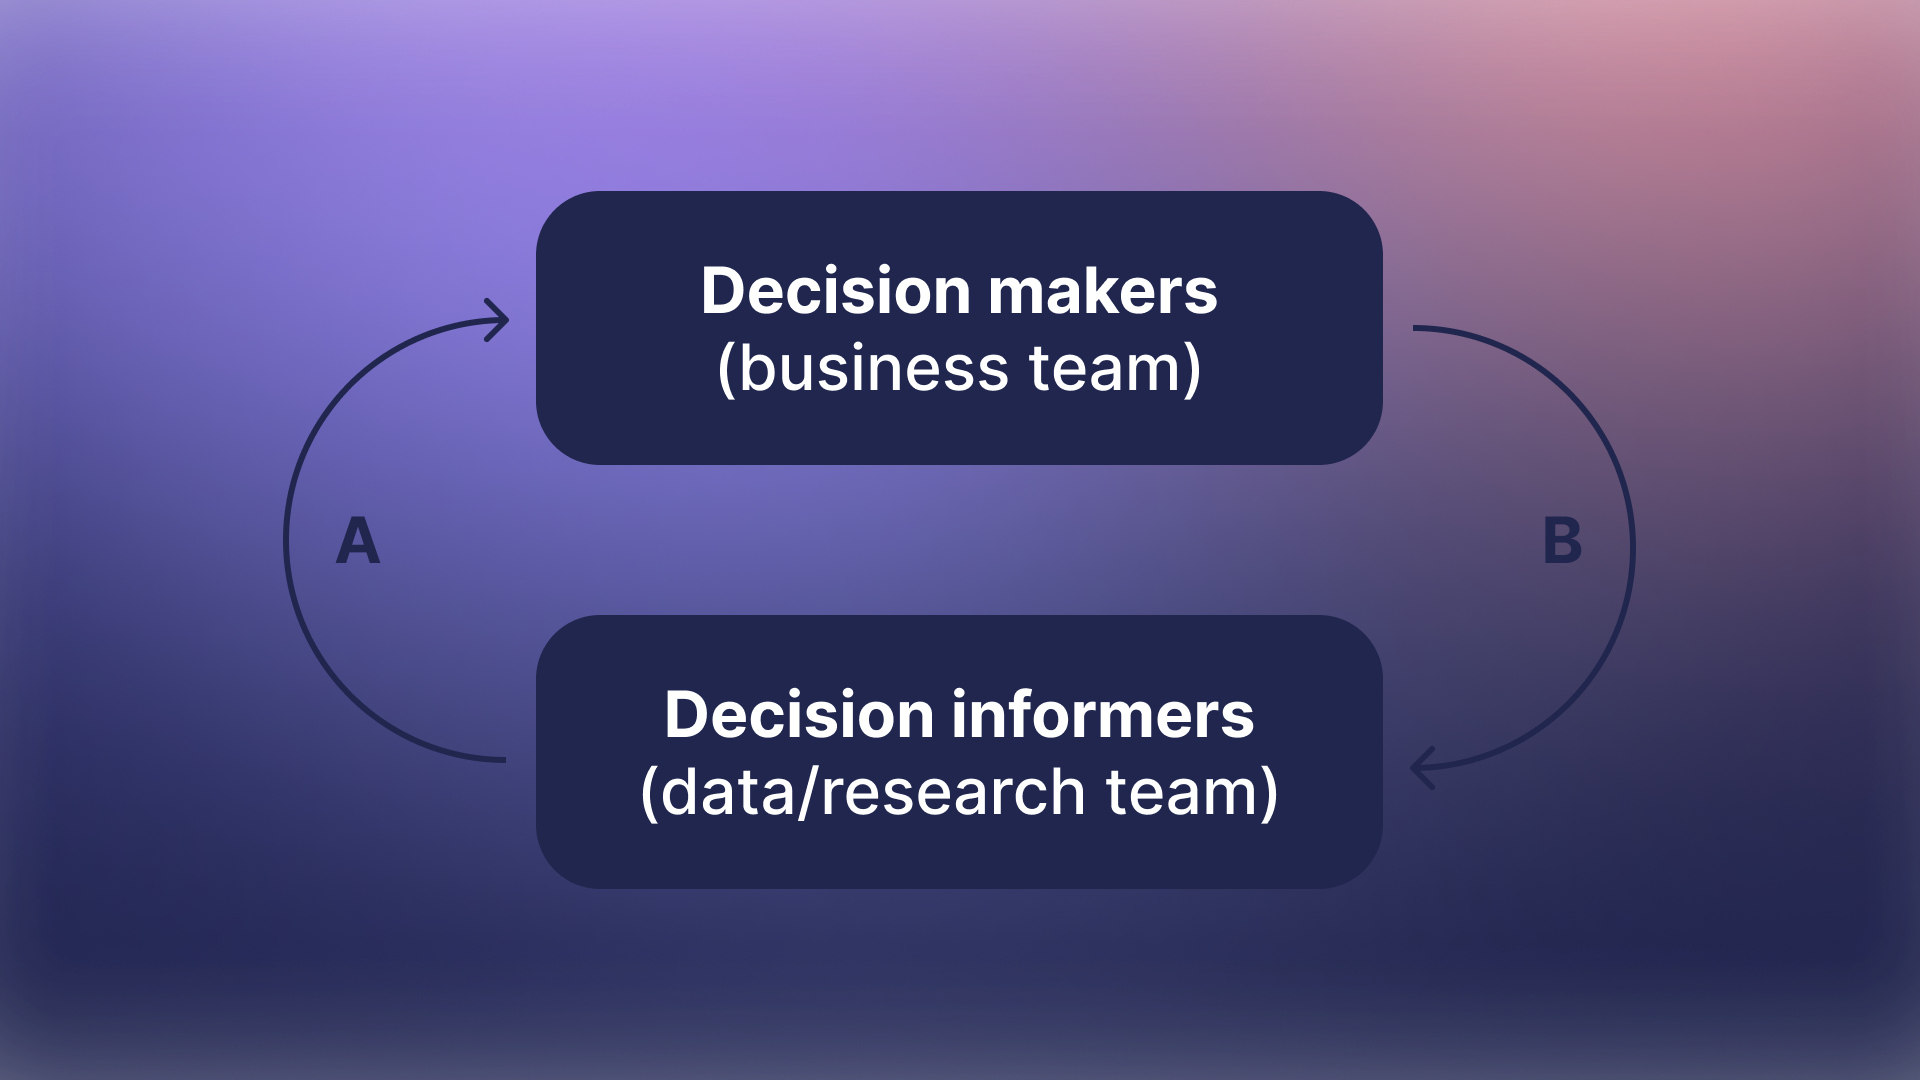
The cyclical relationship between the organizational teams that (should) use metrics
Klipfolio – Helping you succeed with data
“Helping people succeed with data” - This is Klipfolio’s mission statement and the focus of our products. What do we mean by “succeed with data”? By ‘success’, we mean making good decisions that help your business grow. By ‘data’, we mean objectively quantifiable, clean, and well-defined metrics. Not surprisingly, as if this author did it by design😉, using data to make good decisions is exactly what’s depicted in the image above. Our products – PowerMetrics, Klips, and MetricHQ – provide a business environment where data teams can extract the elemental building blocks of data from data sources and transform them into consistent, trustworthy, widely-accepted metrics. These business metrics can then be shared with and visualized by business teams to inform their decision-making process.
Good business decisions are based on data - not instinct
Any data team that prides itself on collecting, analyzing, and synthesizing large amounts of data to make sense of complex problems will cringe when a decision maker says, “I just went with my gut.” Ugh. It’s not that the primitive and mostly unconscious processes that form the basis of gut decisions don’t have a time and place – they do (e.g., quickly evaluating social situations). It’s simply that when it comes to making difficult and important business decisions, relying on your gut alone is a bad idea. Of course, when you bring this up with the gut decision makers, they tell you about all the times their “instincts” led them in the right direction. They seem to have a harder time remembering when their instincts led them astray. Funny that.
Metrics are the antidote that every team of chronic gut decision makers needs when evaluating the health of their business. By virtue of their quantitative roots, metrics are unbiased and can be tracked over time to reveal empirically assessable trends in your business data. Metrics are the closest approximation to the true state of your business’ past, current, and future (predicted) performance.
Inseparable: The relationship between research and metrics
Full disclosure – In case you haven’t already guessed, I’m firmly entrenched in the decision-informer category, as a mixed-methods researcher with a prominent tilt toward quantitative research methodologies. I’ve worked with metrics for decades in order to better understand human behaviour. As such, I believe I can accurately comment on how quantitative researchers, as part of a larger data team, interact with metrics with the goal of sending the most pertinent information to the business teams (pathway A in the image above).
As every researcher worth their salt knows, one of the tenets of scientific research is to be as objective and unbiased as possible. Easier said than done, as that chunk of gray matter that resides between every researcher’s ears tends to allow bias and subjectivity to creep into the process. Thankfully, through refinements to the scientific method and the advent of metric analysis, the impact of these human tendencies has been reduced.
Business metrics are well defined and universally adopted
One methodological refinement is to rely more heavily on well-defined, universal measurements that are verifiable and reproducible. Business metrics fit the bill. Revenue and Customer Acquisition Cost Ratio (CAC Ratio) are two examples of universally-adopted business metrics with clear definitions. These metric qualities enable business teams to confidently measure and calculate them, discuss results within the team (and resolve discrepancies if they exist), track them over time, and compare trends to industry standards. While there’s always room for some nuance when calculating these business metrics (e.g., how to best identify and remove outliers) they are, by and large, unaffected by subjectivity.
Metrics work well with large data sets for more accurate results
Metrics lend themselves to being collected in large quantities, stored in databases, and organized so they can be easily aggregated and segmented. These larger data sets work well for statistical methods (e.g.,for performing inferential and predictive analyses. In contrast, smaller data sets (e.g.,those collected from user interviews) are typically not adequate for inferential statistics. Applying generalizations from a small sample to the larger population isn’t warranted. Smaller data sets are not as effective when building models for a wide range of business activities, from predicting an individual user’s behaviour to forecasting profit margins for the next quarter.
The proliferation of data collection, storage, and analytics tools has made it easier than ever for even the smallest data teams to build, maintain, monitor, and share key business metrics. You no longer need to be a large company to have business metrics at your fingertips.
Metrics, metrics everywhere: The researcher’s path to meaningful metrics
The ease with which metrics can be created is a double-edged sword. Just because you can doesn’t mean you should. Measuring anything and everything risks drowning out signal with noise, obfuscating the truth and overwhelming the decision makers. I’m reminded of a joke I heard about a substandard buffet where one patron asks another, “If you think the food is terrible - why do you keep coming here?” to which the other patron replies, “Because there’s so much of it!” One of the key responsibilities of the data team is to curate a subset of metrics that are proven to be useful indicators of business health.
Certainly, there is a standard suite of metrics that most businesses track. But, as no two companies are alike, there will always be a need for data teams to build a set of custom metrics that are unique to their business’ requirements. As a member of the data team, you should be selective when creating the list of curated metrics. Feel free to explore different metrics, but only track and amplify those that enable meaningful, actionable insights.
Here’s an example I experienced first-hand as a researcher at Klipfolio. We were using the metric “Activation Rate” as a leading indicator of conversion (i.e., users who upgrade to a paid subscription) in our PowerMetrics product. Although activation rate is a metric that many businesses track, there isn’t a universal way of defining it. At Klipfolio, our definition of an “activated” user was someone who performed ‘Action A’ within the first 24 hours and then again at some point after the first 24 hours. This definition seemed to make sense and there were many reasons why it should have been a good predictor of conversion. However, it didn’t turn out that way and we soon discovered we needed to find a better metric.
The data team looked closely at all of our behavioural data to determine what (weighted) combination of events to use. Their research resulted in a new, more effective predictor of conversion – the “Activation Score” metric. Activation Score is a scaled metric, with each user falling somewhere on the scale depending on which behaviours they perform and how often they perform them. Nowadays, whenever our data team is asked to provide evidence that a product change is having a positive impact, they focus on Activation Score, not Activation Rate.
Metrics – The answer to data-driven research and decision making
Metrics are one of the best ways to make sense of the business world. Working together, data and business teams create a set of reliable single-source-of-truth metrics. Using these universally defined and accepted metrics, a company can track business progress and make informed decisions based on real data, not gut instinct.
Metrics connect the data extraction, organization, and analysis process and result in actionable insights. By design, metrics make it easy to collect and store large amounts of quantitative data, which is exactly what is needed to make informed decisions about your business. The more difficult task is separating informative data from vanity metrics - numbers that look good on a chart, but don’t reveal anything meaningful about the state of a business. This is where the data and research teams earn their keep.
Advances in information technology and the refinement of supporting software has made the metric-centric approach to monitoring business health accessible to everyone, regardless of company size. So why wait? With meaningful, accurate, consistent, and actionable metrics at your fingertips, you’ll be set up to succeed with data.
 |
|