


Ready for the 3rd generation of BI software?
Part 1: The evolution.


Summary - Over the years there’s been substantial investment in BI solutions – so why are so many of us still using spreadsheets?! In this article, the first in a two-part series, we look at the evolution of BI software design and see how the most recent generation of analytics can help us escape spreadsheets and embrace modern data tools.
The evolution of Business Intelligence (BI) software design has been fuelled by the need to understand and effectively use data to make good decisions. However, studies show that more than half of businesses still struggle to generate value from their data or move beyond spreadsheets.
How can we unlock the potential of BI software for business and data teams? Until recently there have been two clear generations of BI software – enterprise BI and departmental/personal BI. Let’s look at how these fall short and why a new third generation design is the key to modern decision-making.
First generation: Enterprise BI
In the 1960s, mainframe computers, with their ability to store and process large amounts of data, became commercially available. It was a first step toward data-driven decision making, however, the exorbitant cost and the need for highly-trained technicians prevented widespread deployment. In the late 1970s, personal computing and tools such as spreadsheets came on the scene, enabling less technical business users to work with data. But, again, there were limitations. Multiple data storage solutions made it hard to know which data to analyze and how to tie everything together to effectively draw conclusions. Also, self-serve analytics tools specifically designed for business users were virtually non-existent.
Complex solutions for experts
Enterprise BI was designed to meet the needs of large organizations. Data experts modelled data into a form that enabled integration with other tools for interaction and visualization. One example of this BI technology is Online Analytical Processing (OLAP) – a common type of BI data model that’s still in use today. Using these integrated tools, specialized report authors consumed the data models and created and distributed reports to their organization’s decision makers. Lightweight analysis tools enabled ad hoc exploration of the data models. Business Objects and Cognos, among others, created large enterprise suites of BI software to meet all these needs.
Screenshots of Cognos Analysis Studio in the 2000s:

Limitations
These suites of BI tools enabled large organizations to process, consolidate, govern, and share their data. However, setting up such a system was costly and time consuming – sometimes taking years to configure and deploy. After initial setup, it took longer still to tweak the data, models, and reports so they could be used effectively by everyone. Ongoing maintenance was also expensive. Even though these BI systems enabled organizations to manage and use their data, the cost and resource commitment was too prohibitive for smaller businesses.
The enterprise BI system was slow to react to requests for new data. If a report didn’t contain the necessary information, decision makers needed to make a request to the report authors or data teams and wait for the reports to be updated. This delay and, potentially, bottlenecked process made it difficult to react to changes in the data and make timely business decisions.
Second generation: Departmental / Personal BI
As larger enterprises were having some success with BI tooling, smaller businesses and departments were still using personal databases and spreadsheets. In the late 2000s lightweight BI software, developed by companies like Tableau and Qlik, began to address the specific needs of smaller organizations and individual departments in larger organizations.
A first step towards data democratization
This second generation of BI tools focused on auto modeling data from spreadsheets and other data sources, providing a less sophisticated but more approachable way to work with data. Automated visualization features reduced the need for deep report authoring and data modeling. Dashboards could be configured independently by business users, and, as a result, were used more often than reports for decision making.
Over the next few years, the use of subscription-based software services, each with its own API, increased dramatically. This fundamental shift in technology enabled a new wave of BI and dashboarding tools, where business users could create dashboards (using a service’s API) for a multitude of data services and common file formats (like spreadsheets). Some software solutions, for example Klipfolio Klips, could also update data in real time. With a little effort any small business or department could set up their own BI solution.

Limitations
This BI software design had its own set of challenges. To work well it needed clean, highly-structured data, which is often not the case with raw, real-world data. To put the data into a consumable format required a certain level of expertise. If users (and organizations) lacked this expertise they ended up just using the data tools directly to get what they needed. So, most users continued to work in spreadsheets. On top of that, spreadsheets and other data tools were adding advanced visualization capabilities, reducing the need for BI software.
Third generation: Metric-centric BI
In recent years, we’ve seen the emergence of a third generation of BI software that revolves around metrics. Metrics capture purpose and data and, unlike reports, directly address the needs of decision makers.
Abstracting meaning from data with metrics
A metric is not only a data structure, it’s also a business concept. Metrics are created because they’re meaningful to a business. What the metric measures and how the data is processed is carefully considered and agreed upon by the organization. As such, metrics represent not just clean data, but also deeply meaningful and understood information.
Let’s look at Key Performance Indicators (KPIs) and metrics. A KPI can be used as a business-only concept that’s measured independently (outside of a technical solution). A metric is an actual data artifact with meaning and metadata. Metrics are supported by technologies such as semantic layers or metric layers.
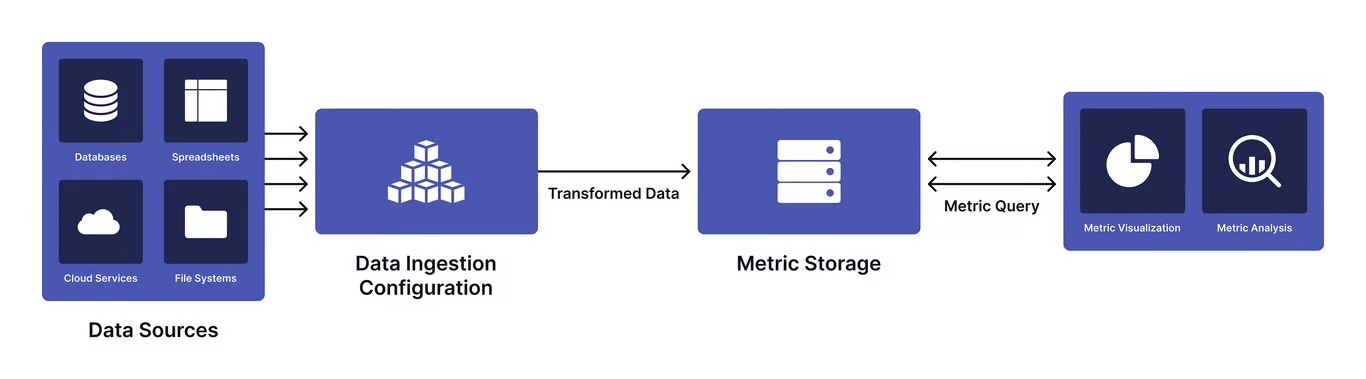
Metric layers store all the information relevant to a metric, including its definition and its data. Transformation and ingestion rules are defined so the system can convert raw data into a format that’s more efficient for the query and storage of metric data.
The concept of metrics and KPIs is not new. Businesses have used these terms to identify and define the information they need to make decisions for some time. What’s new is that they’re being seen as first level artifacts in BI systems along with tooling that supports their direct use in decision making.
A metric artifact has a definition, independent of its data, that delineates its purpose. Business teams can define metrics (without the need for data) and data teams can connect specific data to those definitions. Stakeholders can agree on the required business metrics – making it easy for data teams to know what data to expose and for decision makers to know what data to use. When new data is needed, it’s much easier (and faster) to update metrics than to regenerate models and reports. This process also has a much smaller impact on existing downstream artifacts.
Metric-centric analytics solutions
Metric-centric visualization and analysis tools focus on everyday operations and working with business data. Report and dashboard authoring doesn’t involve mapping to data; it centers on using the right metrics and presenting the data effectively. Settings that could affect the meaning of the results are not exposed in the metric query language. So, querying the metric can’t produce incorrect results as long as the metric is properly configured.
Metric-centric BI differs from its predecessors. It focuses on the metric abstraction and business intent of the data artifact, not on generic data models and presentational reports. With its metrics catalog and integrated self-serve analytics, Klipfolio PowerMetrics is an example of a 3rd gen BI tool. It’s built for non-technical business users but data teams also get involved by building native metrics and setting up connections to semantic layer metrics for business team consumption.
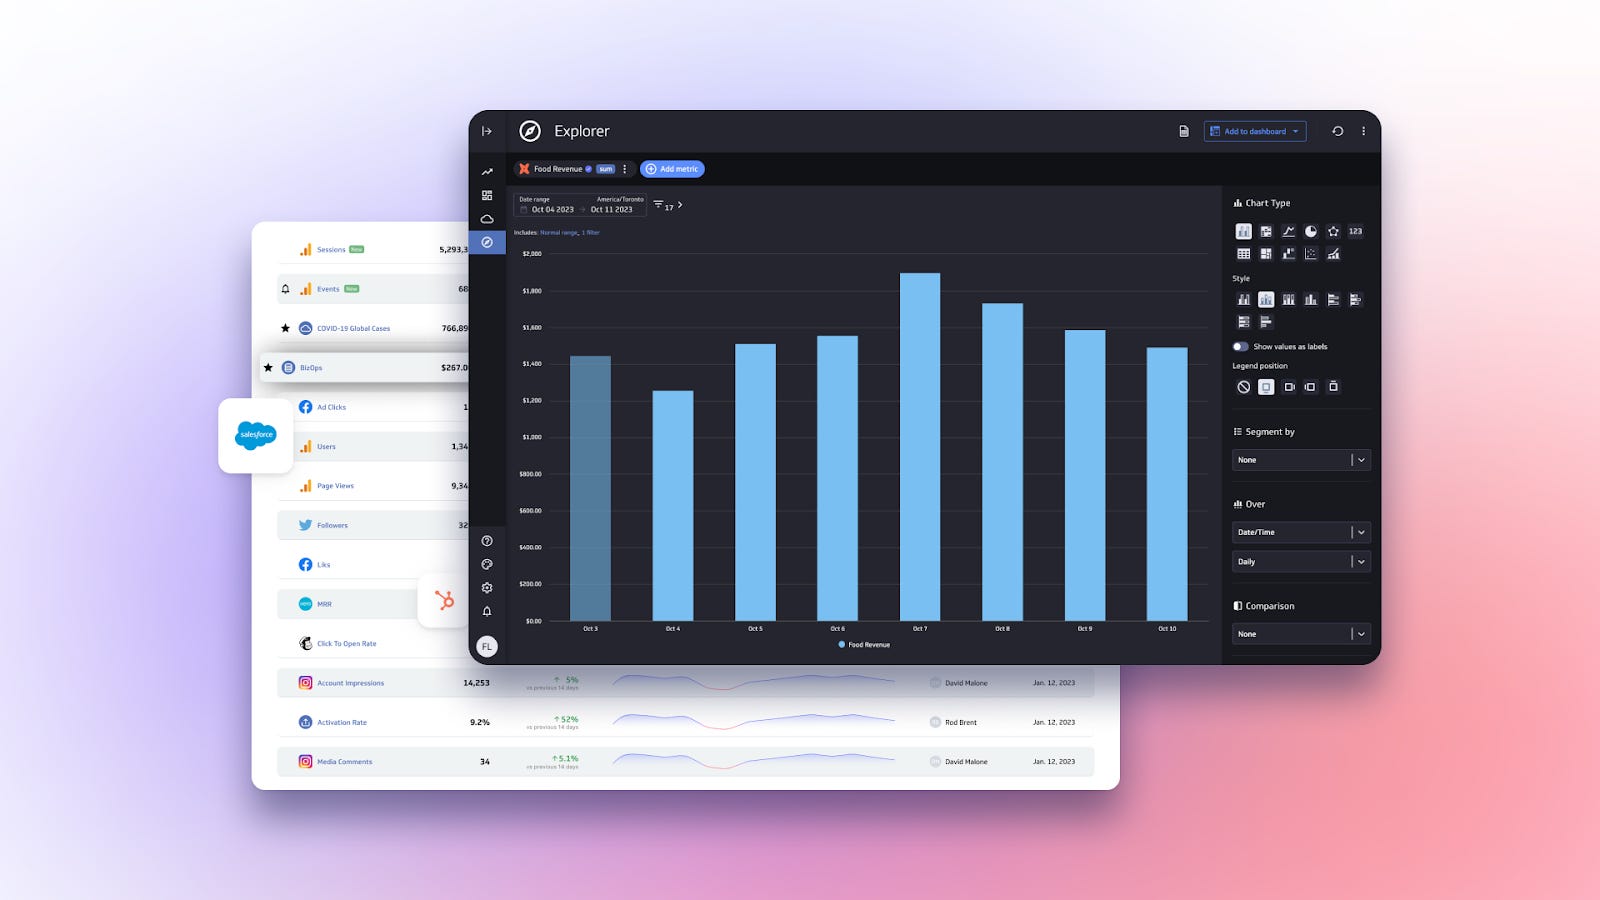
A metrics catalog lists and organizes a company's metrics. From here, business users can access metrics, perform straightforward data analysis, change visualizations, and build dashboards and reports.
Making universal BI adoption a reality
It’s been said the main competitor to any BI tool isn’t another BI tool, it’s the common spreadsheet. That’s because, despite their strengths, the value of the first 2 generations of BI tools depended too much on the availability and state of the data. Spreadsheets are easy to use and integrate well with data manipulation tools. The value that a first or second generation BI tool provided over spreadsheets was incremental, not transformative.
Metric-centric BI, the 3rd generation of BI tools, has the potential to make universal adoption a reality. The purpose that’s defined and built into the BI artifacts in these tools, simply isn’t captured in spreadsheets or previous generation BI tools. This purpose, that’s built into every metric, ensures decision makers have access to the right data and understand how to use it. Metric-centric business intelligence is business intelligence with purpose.
In the second part of this series, we’ll dive into the opportunities that metric-centric analytics products provide to everyone. We’ll also look at how they help future-proof organizations, with a focus on artificial intelligence (AI). Stay tuned!